Quantitative & Qualitative Data In Impact Reporting: A Guide
More and more nonprofits are embracing the opportunity to evaluate and share the effects their work has on their communities through a process called impact reporting. This process makes it much easier for you to stay accountable to your stakeholders and provide evidence that your organization is truly making a positive difference in the lives of your beneficiaries.
Measuring and reporting your impact involves tracking your organization’s progress toward smaller objectives that together help you accomplish your overall mission. Data plays an integral role in determining how well you’re accomplishing these objectives, and there are two primary types to consider: quantitative and qualitative.
You’ll need to collect and analyze both types of data to tell the full story of your organization’s impact. In this guide, we’ll explore what distinguishes quantitative data and qualitative data and how you can weave both types of insights together for more robust impact reporting.
Here’s a graphic that provides a quick overview:
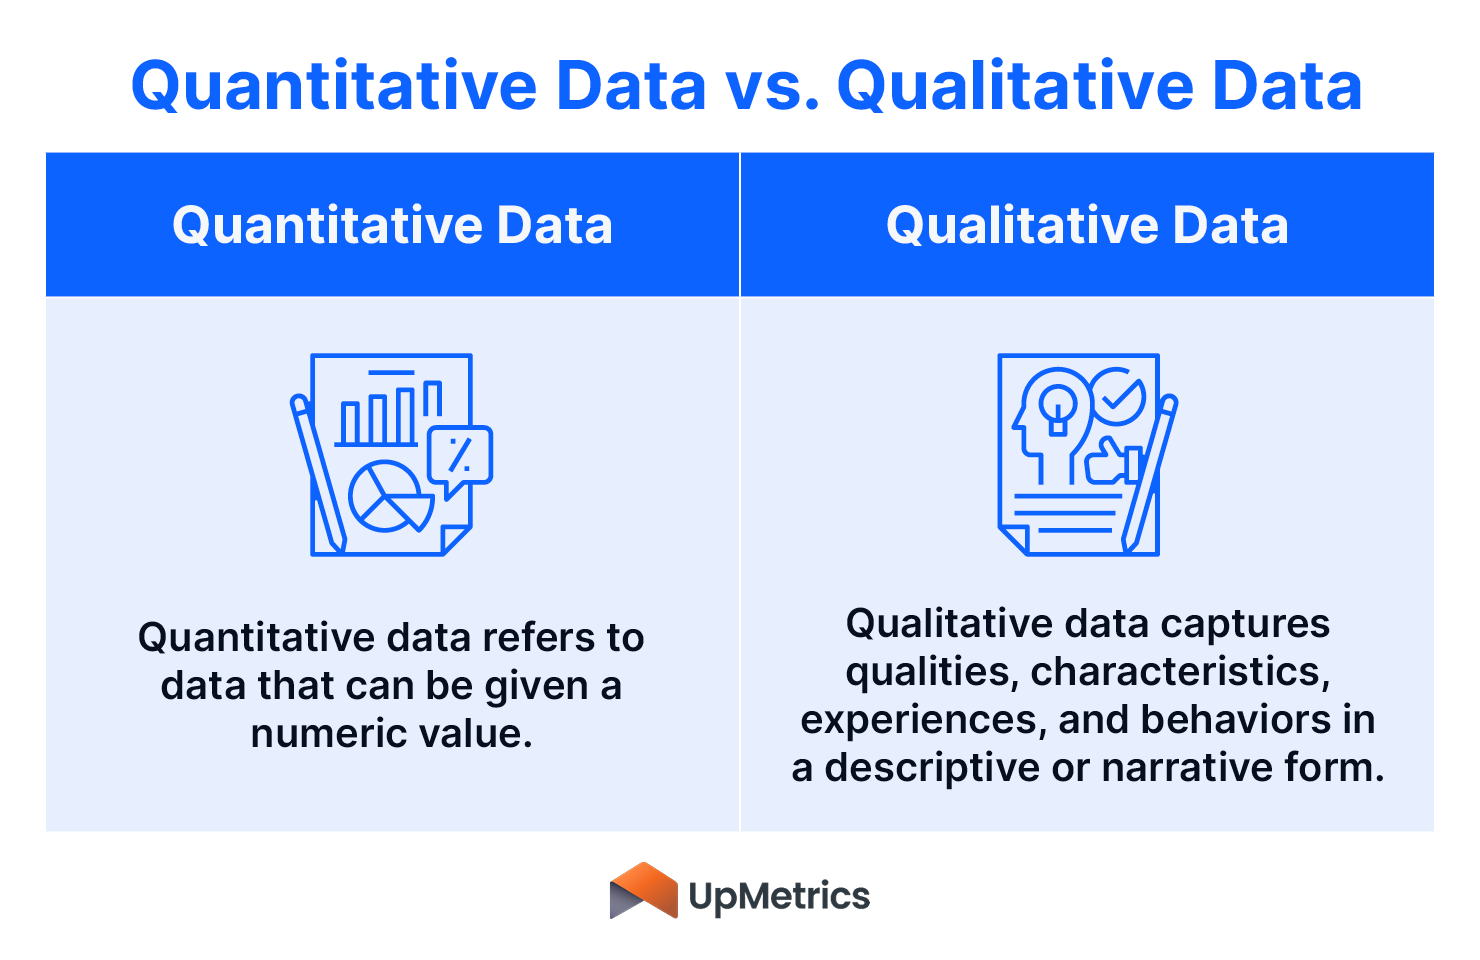
Quantitative Data
Quantitative data is the data your organization collects that can be given a numeric value.
Here are some examples:
- Annual number of hours volunteered
- Average donation size
- Program attendance rates
- Improvement percentages in metrics like academic performance
- Engagement rates on social media posts
- Number of attendees at your most recent fundraising event
- Return on investment for a fundraising campaign
- Number of items delivered or services rendered
The beauty of quantitative data is that it’s often easy to gather. Many of your existing technology solutions are primed to provide quantitative data. For example, to learn about your average donation size or program attendance rates, you can turn to a constituent relationship management (CRM) system like Salesforce. You can also gather more general insights about your cause or beneficiaries from publicly available data compiled by government agencies or academic institutions.
Quantitative data can also give you a more objective view of your organization’s impact and performance over time. For instance, it’s hard to dispute the need for your food pantry and whether it’s making a difference when you can clearly see the number of families served increase over the last three years.
Analyzing your data, however, can get tricky, especially if yours is a large organization with a lot of programs or other moving parts. You’ll need to engage in statistical analysis to go beyond the surface-level numbers, and many organizations may not have the bandwidth to do this on their own. In this case, consider outsourcing the work to a data scientist or using a robust impact measurement and management (IMM) platform that can handle this part of the process for you.
In the meantime, prepare your quantitative data for analysis by prioritizing data hygiene and quality. This involves regularly auditing your data sources (like your database or marketing platforms) to ensure your information is accurate, up-to-date, and collected in a uniform way (i.e., all donor addresses are formatted in the same way). Keeping your data organized and error-free will make the data analysis process go smoothly and ensure you get accurate, actionable insights.
Qualitative Data
Qualitative data is the data that captures qualities, characteristics, experiences, and behaviors in a descriptive or narrative form.
Here are some examples of qualitative data:
- Testimonials from your beneficiaries
- Insights gathered from a focus group of stakeholders
- Survey responses from program participants
- Detailed notes from staff observing a volunteer activity
- Interviews with major donors
- Videos taken at your annual fundraising gala
- Photos of a recent facility remodel
As you can see, qualitative data is the information that shows there is more to the story than just numbers. Here’s how UpMetrics explains it: “Qualitative data is just as important as quantitative data. It breathes life into the cold hard numbers and adds valuable context and depth to your impact insights.”
There are dozens of ways to gather qualitative data about your impact. But no matter the method—surveys, interviews, focus groups, etc.—it will almost always involve capturing another person’s thoughts and perspective about your work.
Let’s return to the food pantry example. Quantitative data analysis shows that you’re serving more families than ever before, but what have those families experienced in receiving food and services from your organization? Interviews with parents may reveal that you’ve helped reduce their stress about putting food on the table. Videos taken at your facility may show families lined up and ready to receive kits full of nutritious meal options. So, the qualitative data you collect paints a fuller picture of how your organization positively impacts lives beyond just filling stomachs.
Much of the time, qualitative data can be paired with quantitative insights to provide more context and information about a trend or pattern you’re seeing. For instance, you might create a report that walks through your food pantry’s performance over the last year. You could include the data about serving more families alongside pictures of families picking up food at your facility. This will help put a human face on your cause and show your community what your work really looks like in action.
You can dive deeper and conduct a formal analysis of qualitative data, too. For this, you’ll need to codify your data and extract themes to get clear insights. This is another task that a data scientist or IMM platform can support.
Integrating Quantitative and Qualitative Insights
When it comes to these two very different types of data, one isn’t inherently better or more useful than the other. Instead, they go hand in hand to help provide a rich understanding of how well your organization delivers its mission.
As you build out an impact report, use quantitative and qualitative insights to show your stakeholders and supporters what is going well and also point out areas where you need additional support.
Here are some tips for doing so:
- Present general numerical metrics alongside personal stories. This will help you illustrate how your operations translate into specific, positive changes in individuals’ lives.
- Use qualitative insights to explain the why behind quantitative insights. For instance, if metrics show a spike in program graduations, use testimonials from beneficiaries to explain what it is about recent changes to your programs that made that spike possible.
- Lean into the power of visuals. Photos of staff or volunteers at work, or images of beneficiaries receiving your services can bring your work to life. Additionally, communicating quantitative insights in a visual way (i.e., through charts, graphs, or infographics) can make them easier to understand.
Data is key to measuring, understanding, and sharing your nonprofit’s impact. As you use quantitative and qualitative data together, you (and your donors and funders) can fully understand the positive effects you’re having on the community you serve.
Prepare for your next impact report by ensuring that you’re collecting a wide variety of data about all aspects of your operations and storing it in an organized, secure way. When the time comes to analyze your data and get insights into your impact, remember you may want to work with an IMM professional to get as much value out of your data as possible. You’ve got this!
{{cta(‘143860426115’)}}